spark measures Minecraft tick times, memory and call paths. Capture the profiler during the actual problem and compare the same load window after a targeted change. An average TPS value alone does not rule out brief server stalls; also check MSPT and spikes. The screenshots come from a test server running Paper 1.21.4.
Installation
spark runs as a plugin on Paper and Spigot and as a mod on Fabric, NeoForge and Forge. In the panel you'll find it under Plugins → Browser. It needs no configuration. The commands belong in the moderator group; the permission node for it is spark. How to assign it is described in LuckPerms: Setting Up Permissions.
First look: TPS and tick duration
/spark tps shows three lines:
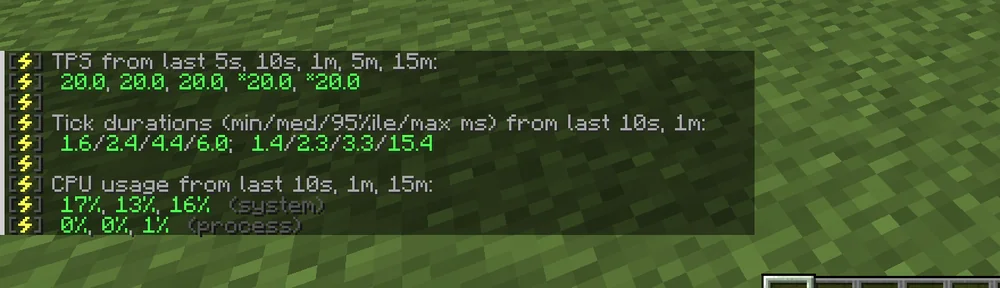
- TPS (ticks per second) over the last 5 seconds, 10 seconds, 1, 5 and 15 minutes. At the normal tick rate, 20.0 is the target value. How noticeable a drop is depends on its duration and the gameplay situation; there is no fixed threshold for "unplayable".
- Tick duration as minimum, median, 95th percentile and maximum in milliseconds. A tick may take 50 ms for 20 TPS to be maintained. In the image the median is 2.4 ms, so the server has plenty of headroom. The 95th percentile is the decisive one: if it is close to 50 ms, you get stutters even though the average looks good.
- CPU usage split into system (the whole machine) and process (only your server). On a rented server, the process value is the important one.
/spark health show outputs a health report with TPS, CPU, memory and disk; --memory adds JVM memory details. Some older versions know healthreport; if in doubt, use the help of your installed spark version.
The profiler: who is eating the time?
When the TPS collapse, you start the profiler:
/spark profiler start
spark confirms the start and keeps running in the background. Let it run for at least a minute while the problem occurs, then:
/spark profiler stop
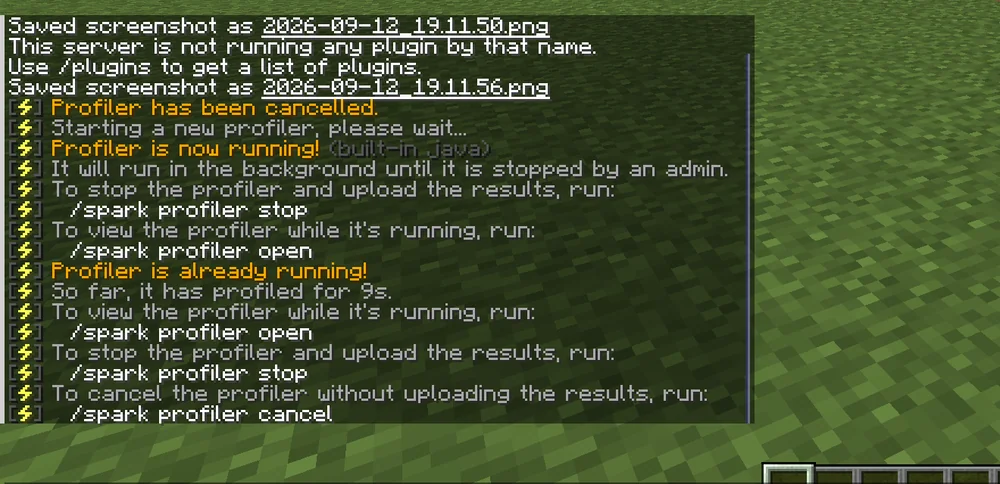
When stopping, spark uploads the report to spark.lucko.me and outputs a link. The report contains call trees and technical metadata; check the content and the privacy documentation before sharing. /spark profiler open also uploads a report for the viewer while the profiler is still running. /spark profiler cancel discards a run that has not yet been uploaded.
In the report, you expand the tree from the top. What you typically find:
- Entity ticks of a certain type: a farm with hundreds of animals or items. Shrink the farm or calm it down with
entity-activation-rangeinpaper-world-defaults.yml. - A plugin in an event listener: update the plugin, check its configuration or replace it.
- Chunk loading by players flying fast: lower the view distance or pre-generate the world with Chunky.
- Redstone clocks: a circuit that never stops. Ask the player to switch it off.
Garbage collection and memory
/spark gc shows how often and for how long Java garbage collection pauses. Many long pauses can point to memory pressure or high allocation rates; they prove neither too little RAM nor a memory leak. Compare heap usage and GC history during the same problem situation. /spark heapsummary lists which object types occupy the memory. Before you book more RAM, it's worth a look here: often a plugin update solves the problem.
Common mistakes
- TPS 20, still lag. Check short MSPT spikes in the problem period, and then the client or network.
/spark pingshows the latency per player. - Forgot the profiler link.
/spark profilerwithout arguments shows the status; after stopping, the link also appears in the server console. - Numbers without comparison. A TPS value alone says little. Measure once with an empty server as a reference.
FAQ
At what TPS value do players notice something?
20 TPS is the target value at the normal tick rate. How noticeable lower values are depends on duration and the gameplay situation. Also check tick duration, 95th percentile and maximum: individual long ticks can cause stutters even though a longer TPS average still looks good.
Does a spark report contain personal data of my players?
A blanket assurance that no personal or confidential data is included is not sensible. Check technical metadata, plugin and configuration details, and the report before sharing. profiler open also creates an upload for the web viewer. With profiler cancel you can discard a run that has not yet been uploaded.
How long should the profiler run?
At least a minute, and while the problem is actually occurring. A run on a quiet server only shows that everything is fine. For sporadic stutters, let it run longer and stop it right after a stall.
Does more RAM help against lag?
More RAM only helps with a confirmed memory bottleneck. /spark gc shows the frequency and duration of Java pauses, /spark heapsummary the object types occupying memory. Also check heap usage, allocations and the timing match with the stalls. GC pauses alone do not prove too little RAM; plugins or a high allocation rate can also be behind them. First compare a targeted fix under the same load.
TPS is at 20 and it still stutters — what now?
An average TPS of 20 does not rule out short tick spikes. Check MSPT and the time of the stall; after that, client and network come into play as separate causes. /spark ping shows the latency per player. For individual affected players, check both their connection and client frame rate and rendering. If several players are affected at the same time, additionally compare shared server and network findings in the same time window. The number of affected players alone does not prove a cause.
Further guides
Pre-generating a world reduces the generation of new chunks; existing chunks still have to be loaded: Chunky: Pre-generating a World. How the panel reports persistently low TPS is described in Minecraft Server Lag: TPS and Watchdog.
Sources
- spark documentation: https://spark.lucko.me/docs/
- Commands: https://spark.lucko.me/docs/Command-Usage
- Reading profiler reports: https://spark.lucko.me/docs/guides/Finding-lag-spikes
Sharing a profiler report in a controlled way
Before recording, note the server version, player load and the specific action during which lag occurs. End the run after a representative problem window and check the report before sharing. An upload can contain technical metadata, plugin lists and configuration information; treat the viewer URL accordingly. profiler open is not a purely local report but also creates viewer access through an upload. If you don't want to upload anything yet, discard the active run with cancel before you use open or stop. Afterwards, compare the same process with exactly one corrected setting.