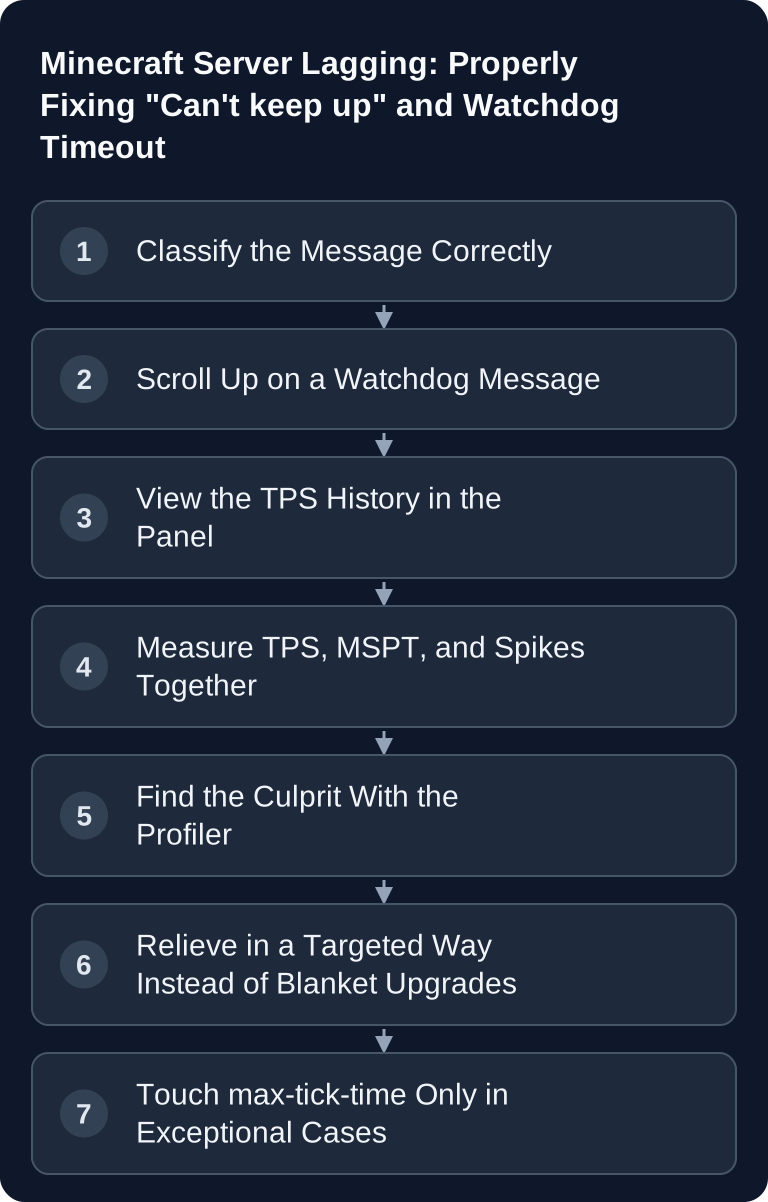
"Can’t keep up", watchdog timeout, and "Exception in server tick loop" are different Minecraft error patterns. First check whether the server is still running, was forcibly terminated, or reports a concrete program error. Lag can also come from the client or network; server TPS do not explain every stutter.
Telling the Three Messages Apart
Minecraft calculates the game world 20 times per second. One such pass is called a tick. For 20 TPS, an average of 50 milliseconds per tick is available. Consistently higher tick times cause server delays; low client FPS or high network latency are other causes and can also occur at a stable 20 TPS.
| Log message | What actually happened | Is the server still running? |
|---|---|---|
Can't keep up! Is the server overloaded? Running 5074ms or 101 ticks behind |
The tick loop reported a time backlog; the cause and current state must be checked | Often yes; the message alone does not prove lasting overload |
A single server tick took 60.00 seconds + Considering it to be crashed |
A single tick exceeded max-tick-time; the watchdog terminated the process |
No, forcibly terminated |
Exception in server tick loop |
An error propagated all the way up to the main loop | No, usually with a crash report |
Dispatched async TPS command (Paper warning) |
Our own TPS measurement queries the server from outside | Yes — this is normal |
The last line regularly causes confusion: Paper reports every query coming from outside as a warning. It is our scheduled performance measurement roughly every five minutes, not an error and not an interference with your game.
The Most Important Step: Read Upward for Watchdog Messages
The watchdog kill is a symptom, not a cause. It only says: something blocked the server thread for longer than allowed. What blocked it is stated elsewhere.
There are two cases, and they lead to completely different measures:
Case 1 — the watchdog came first. Before the watchdog line there is normal gameplay. Then the tick time really is the message: something froze the server during operation.
Case 2 — the watchdog came afterwards. Before the watchdog line there is already Stopping server or Preparing crash report. Then the server was already dead or shutting down, and the watchdog merely cleaned up a hanging shutdown.
This second case is not a fringe phenomenon. In a support case from August 22, 2026, the server thread crashed at 13:20:15, began a clean Stopping server — and only 60 seconds later did the watchdog fire. Anyone who blames the tick duration there sends the operator past the real error message that was a minute further up. That is exactly why our console analysis deliberately evaluates the watchdog hit last: if a more specific signature is in the same log section, you are shown that statement and not "a tick was slow".
Step by Step to the Cause
1. Check the TPS history in the panel
Open your server in the panel. Under "Performance (last 24h)" you can see the TPS history; it is measured about every five minutes while the server is running. The shape of the curve already says a lot:
- A sharp drop at a specific time → an event. Match the time against the log: world generation, a backup, a player in unexplored terrain, a plugin task.
- Consistently low values → structural overload. A restart does not help here; relief does.
- Sawtooth pattern → possible periodic load. Check GC pauses, memory usage, and recurring tasks at the same time; the pattern alone does not prove memory pressure.
If the values stay low over a longer window, the panel will report on its own with the notice "TPS persistently low".
2. Measure MSPT — TPS alone is not enough
In-game, use /spark tps with appropriate permissions, or in the panel console spark tps without the slash. Check both metrics together:
- TPS — ticks per second, maximum 20.
- MSPT — milliseconds per tick. Consistently under 50 ms leaves time for the next scheduled tick; also check spikes and the remaining headroom.
Why MSPT? When processing takes under 50 ms, the tick loop waits until the next scheduled tick to maintain 20 TPS. Therefore both low tick times and times just under 50 ms can show up as 20 TPS. MSPT shows the time consumed and thus the remaining headroom. Besides the average, also check high percentiles and individual spikes; at 45 ms, much less headroom remains than at 15 ms, without this implying any particular next cause of lag.
On Paper from 1.21, spark is already included; you do not need to install anything.
3. Profile the culprit
Do not guess which plugin is to blame — measure it:
/spark profiler start --timeout 120
Recreate the situation that lags during these two minutes. Then open the result link that the server outputs. The report shows, sorted by time share, where the tick time goes: a specific mod, a plugin task, chunk loading, entity processing, or garbage collection.
This is the point where this guide departs from "buy more RAM". The profiler answers the question that a recommendation table cannot: What exactly costs time on your server?
4. Relieve in a targeted way
What the profiler shows determines the measure:
| Profiler shows | Effective measure |
|---|---|
| Chunk loading, world generation | Limit view and simulation distance based on the findings; for lag from new areas, consider pre-generation suited to the world |
| Entity processing | Limit mob farms, fence in animals instead of letting them roam freely, clean up item accumulations |
| Redstone / block ticks | Reduce fast continuous clocks and unnecessary redstone ticks; measure again after each change |
| A single plugin or mod | Disable it as a test and measure again; look for an alternative or a newer version |
| Garbage collection | Check heap usage, GC pauses, and allocation load; more RAM only for a confirmed memory bottleneck |
The last point is important: RAM only fixes a memory problem. If a redstone clock eats the tick time, a larger plan does not make the server faster. How to plan your memory needs based on software, world, and actual load is explained in Planning and Measuring Minecraft RAM Requirements.
5. max-tick-time — the exception, not the solution
The value is in server.properties and determines at which tick duration the watchdog intervenes. The default is 60000 milliseconds, i.e. 60 seconds. If the value is exceeded, the server shuts itself down.
Many guides online recommend disabling the watchdog with -1 at this point. Do not do this as a standard solution. The watchdog detects a server thread that has been blocked for too long. With -1, this protection is gone; a frozen process can persist without the watchdog abort. That guarantees neither reachability nor a helpful error message. You have removed the indicator, not the problem.
A justified exception can be: a known process legitimately takes a long time. The classic case is the first start of a large modpack, where world generation and mod initialization together spend over a minute in a single tick. Then a value of, for example, 180000 (three minutes) is acceptable — temporarily, and with the intention of resetting it after the first successful start.
When Exception in server tick loop Is in the Log
This message points to a program error in the tick loop. Read the full stack trace including any Caused by: lines. Mod, plugin, or library classes named there are hints to the affected code; the class name alone does not yet prove a responsible culprit.
Procedure:
- Search for
Caused by:and note the class name. - Map the named mod, plugin, and library classes to their versions and check dependencies; do not derive the cause from a name alone.
- If the error occurred after a change (new mod, update, new world), undo that change first.
- If the error remains unclear, hand the complete section to support — with the time.
Your server's console analysis detects these lines automatically and explains each detected message in plain language, including frequency. If you only have a log snippet from elsewhere, you can paste it into our Crash Report Analyzer — even without a server with us.
What We Handle Automatically for You
- Performance measurement without any effort. TPS is recorded roughly every five minutes and displayed in the panel for 24 hours — you do not need to install a plugin for that.
- Warning on sustained weakness. If performance stays low over a reliable time window, you will be notified instead of having to notice it yourself.
- Explained log lines. Detected messages get a cause and solution in plain language, in your language — and, where a suitable guide exists, a link to it.
- Symptom-before-cause rule. If a more meaningful error message than the watchdog kill is in the same log section, we show you that one.
Troubleshooting: Symptom, Check, Solution
| Symptom | Check | Likely solution |
|---|---|---|
| Lag only when exploring new areas | Does it occur when players walk into unexplored terrain? | World generation; lower simulation-distance, have the world pre-generated |
| Lag at fixed times | Match the time against scheduled tasks | Shift the backup or restart plan in time |
| Server stops without error, log ends abruptly | Is A single server tick took at the end? |
Watchdog kill; read the minute before it |
| TPS shows 20, but it still stutters | /spark tps — look at MSPT |
Check MSPT including spikes; with normal tick performance, also compare client FPS and network |
| After adding a mod | Remove the mod and measure again | Mod conflict or load-intensive mod |
| Sawtooth in the TPS history | Check the profiler for garbage collection | Check memory pressure; raise RAM only for a confirmed bottleneck |
| "Dispatched async TPS command" in the log | Only this line, otherwise unremarkable | Nothing to do — our measurement |
FAQ
At what TPS value do players notice something?
That depends on the gameplay, load spikes, and the players; there is no reliable blanket perception threshold. Minecraft aims for 20 TPS. Also check MSPT and spikes, because 20 TPS occurs with both large and small remaining tick headroom.
Does more RAM help against lag?
Only for a confirmed memory bottleneck. A high garbage collection share alone does not prove a heap that is too small: check heap usage, GC pauses, allocation load, and conspicuous extensions together. Additional RAM does not fix a CPU-heavy redstone clock or mob farm. Measure first and test the same load after each change.
Should I turn off the watchdog?
No, not permanently. -1 turns off the automatic watchdog detection of a blocked server thread. A temporary increase of max-tick-time for a known slow process such as the first modpack start is acceptable — reset it afterwards.
Why is the watchdog message after "Stopping server"?
Because the server was already shutting down and got stuck in the process. The watchdog then cleaned up a hanging shutdown, rather than killing a running server. The cause is before the Stopping server.
Does a restart help?
Against an acute backlog, yes; against the cause, no. If the lag returns within a short time after every restart, it is structural — then only measurement takes you further.
What is the difference between view-distance and simulation-distance?
view-distance determines how far players can see; simulation-distance determines how far the world is actually calculated. Read the current values in your specific software and panel setup. Simulated chunks cause tick work; view chunks must also be loaded, possibly generated, and transmitted. Lower one value at a time in a controlled way and compare tick time, memory usage, and gameplay under the same load, instead of deriving a fixed relief from the parameter alone.
If It Still Lags
Before a support request, gather three things: the exact time of the last incident, the link to your spark profiler report, and a note on which mods or plugins were added most recently. This allows the matching section in the log to be checked in a targeted way, instead of running a general optimization round.
General adjustments across all games — restart plans, plan selection, network — can be found in the guide Improving Game Server Performance. How to cleanly install and remove mods and plugins is covered in Installing Minecraft Mods and Plugins.
Do you want a server that comes with TPS measurement, log explanations, and warnings without extra work? At Rent a Minecraft Server you will find the matching plans.
Sources and Verification Status
max-tick-time, tick rate, and distances: PaperMC — server.properties. Documents the default value of 60000 milliseconds, the forced shutdown when exceeded, disabling with-1, and the default values of 10 forview-distanceandsimulation-distance.- spark is included in Paper: PaperMC — Profiling. From Paper 1.21, no separate download is needed.
- TPS, MSPT, and tick headroom: spark — TPS and MSPT and The Tick Loop. Explain the scheduled 20 TPS cadence, the consumed tick time, and why averages without a spike check do not provide a complete load diagnosis.
- Profiler commands: spark — Command Usage. Source for
/spark profiler start --timeout <seconds>and/spark profiler stop.
Source check: October 7, 2026. The described support case is a historical case from August 22, 2026; no new in-game load test was performed for this revision. Default values and commands can change with new server versions; check the linked manufacturer documentation for your specific setup.
Comparing the Time Instead of Just the Last Log Line
Note when players notice delays and when the first warning appears. Check MSPT, TPS, and the affected process in the same period: new chunks, a world save, or a plugin event. In the case of a watchdog abort, the usable cause is often before the final message. Back up the crash report and the last log section before a restart makes them hard to follow. If server ticks stay normal and only one player is affected, check that player's ping and client FPS. Only change max-tick-time after the cause; a longer deadline does not speed up any tick.